Stockalyze 2014 Details
Freeware 8.53 MB
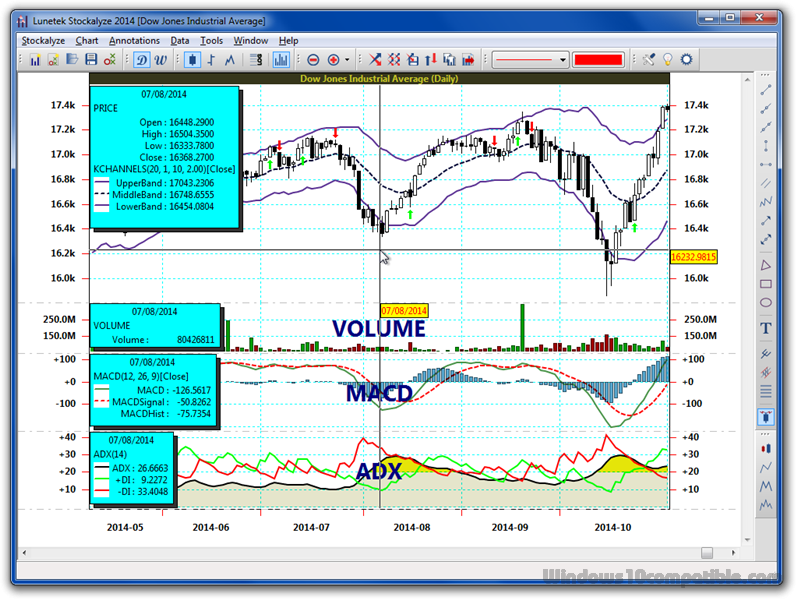
You can create technical chart with more than 50 indicators. Many times you need to create indicator of indicator and stockalyze has a cool feature to do that. Just drag an indicator and drop it on another and you are done. You can also create point-and-figure chart. The box size of point-and-figure chart in Stockalyze is continuously increasing instead of jump increase at certain price. In Stockalyze you can define Trading system using GUI.
Publisher Description
 Create Technical chart of EOD (End of day) stock price data.
Many indicators: Moving Averages, Bollinger Bands, MACD, ADX, RSI, MFI and more than 50 other technical indicators.
Ability to create composite indicators by simple drag-drop operation.
Point and Figure chart: Create Point and Figure chart with adaptive box sizes.
Fibonacci retracements, and Linear Regression channels.
Portfolio and Watchlists so that you can keep eye on investments and opportunities.
Alert system: You can set alert based on Trading System and price so that you don't miss the investment opportunity.
Free data download: More than 50 stock exchage data available for free using built-in feature of downloading free stock price data from Yahoo! and Google. So you can start using Stockalyze without subscribing for data. Stockalyze can also read Metastock data.
Trading Systems: Stockalyze has many built-in trading systems and you can define your own Trading System using easy to use graphical user interface (GUI).
System Tester: Back testing of Trading Systems.
Stock Idea Finder: Use it to scan/explore stocks.
Pattern Detection: Stockalyze can detect candlestick, zigzag, double top, and head & shoulders patterns.
Annotation:You can add trend-lines, ray, Andrew's Pitch fork, triangle, rectangle, oval, texts, and many other annotation objects on chart.
You can start using Stockalyze just after installation. No configuration is needed.
Create Technical chart of EOD (End of day) stock price data.
Many indicators: Moving Averages, Bollinger Bands, MACD, ADX, RSI, MFI and more than 50 other technical indicators.
Ability to create composite indicators by simple drag-drop operation.
Point and Figure chart: Create Point and Figure chart with adaptive box sizes.
Fibonacci retracements, and Linear Regression channels.
Portfolio and Watchlists so that you can keep eye on investments and opportunities.
Alert system: You can set alert based on Trading System and price so that you don't miss the investment opportunity.
Free data download: More than 50 stock exchage data available for free using built-in feature of downloading free stock price data from Yahoo! and Google. So you can start using Stockalyze without subscribing for data. Stockalyze can also read Metastock data.
Trading Systems: Stockalyze has many built-in trading systems and you can define your own Trading System using easy to use graphical user interface (GUI).
System Tester: Back testing of Trading Systems.
Stock Idea Finder: Use it to scan/explore stocks.
Pattern Detection: Stockalyze can detect candlestick, zigzag, double top, and head & shoulders patterns.
Annotation:You can add trend-lines, ray, Andrew's Pitch fork, triangle, rectangle, oval, texts, and many other annotation objects on chart.
You can start using Stockalyze just after installation. No configuration is needed.
Download and use it now: Stockalyze
Related Programs
TickInvest - Stock Charting and Technical Analysis
TickInvest is a stock charting and technical analysis software with realtime and eod charts. Features: Trade Simulator, Backtester, Backtest Optimizer, Stock Screener, Alerts, Custom Drawing Tools, Stock Quotes, Extensible Formula Language. Analyze your favorite stocks with ready to use Indicators...
- Shareware
- 07 Aug 2016
- 30.65 MB
OnBarcode2D Technical Group
With the new OnBarcode2D Technical Group alternative from the expert development team at IronSoftware, you get a simplified utility for scanning, creating, and editing barcode and QR code technology. This brings a wealth of versatility to project build by allowing...
- Shareware
- 23 Mar 2023
- 926 KB
Vivaldi Technical Preview 3
A Browser for Our Friends In 1994, two programmers started working on a web browser. The idea was to make a really fast browser, capable of running on limited hardware, keeping in mind that users are individuals with their own...
- Freeware
- 20 Jul 2015
- 35.32 MB
Technical Documentation Copy+Paste Kit
No, this kit will not write your next user manual or your next online help system for you. However, this kit will help you to write your technical documentation with less effort, and it will help you to produce user-friendly,...
- Shareware
- 20 Jul 2015
- 12.46 MB
SuperPie Free HTML5 Pie Chart Library
SuperPie is a free HTML5 pie chart library. Using the free SuperPie HTML5 pie chart library to display pie charts on your web pages is very easy. Values, labels and colors are configured using simple JavaScript. No software installation is...
- Freeware
- 20 Jul 2015
- 1 KB